Image
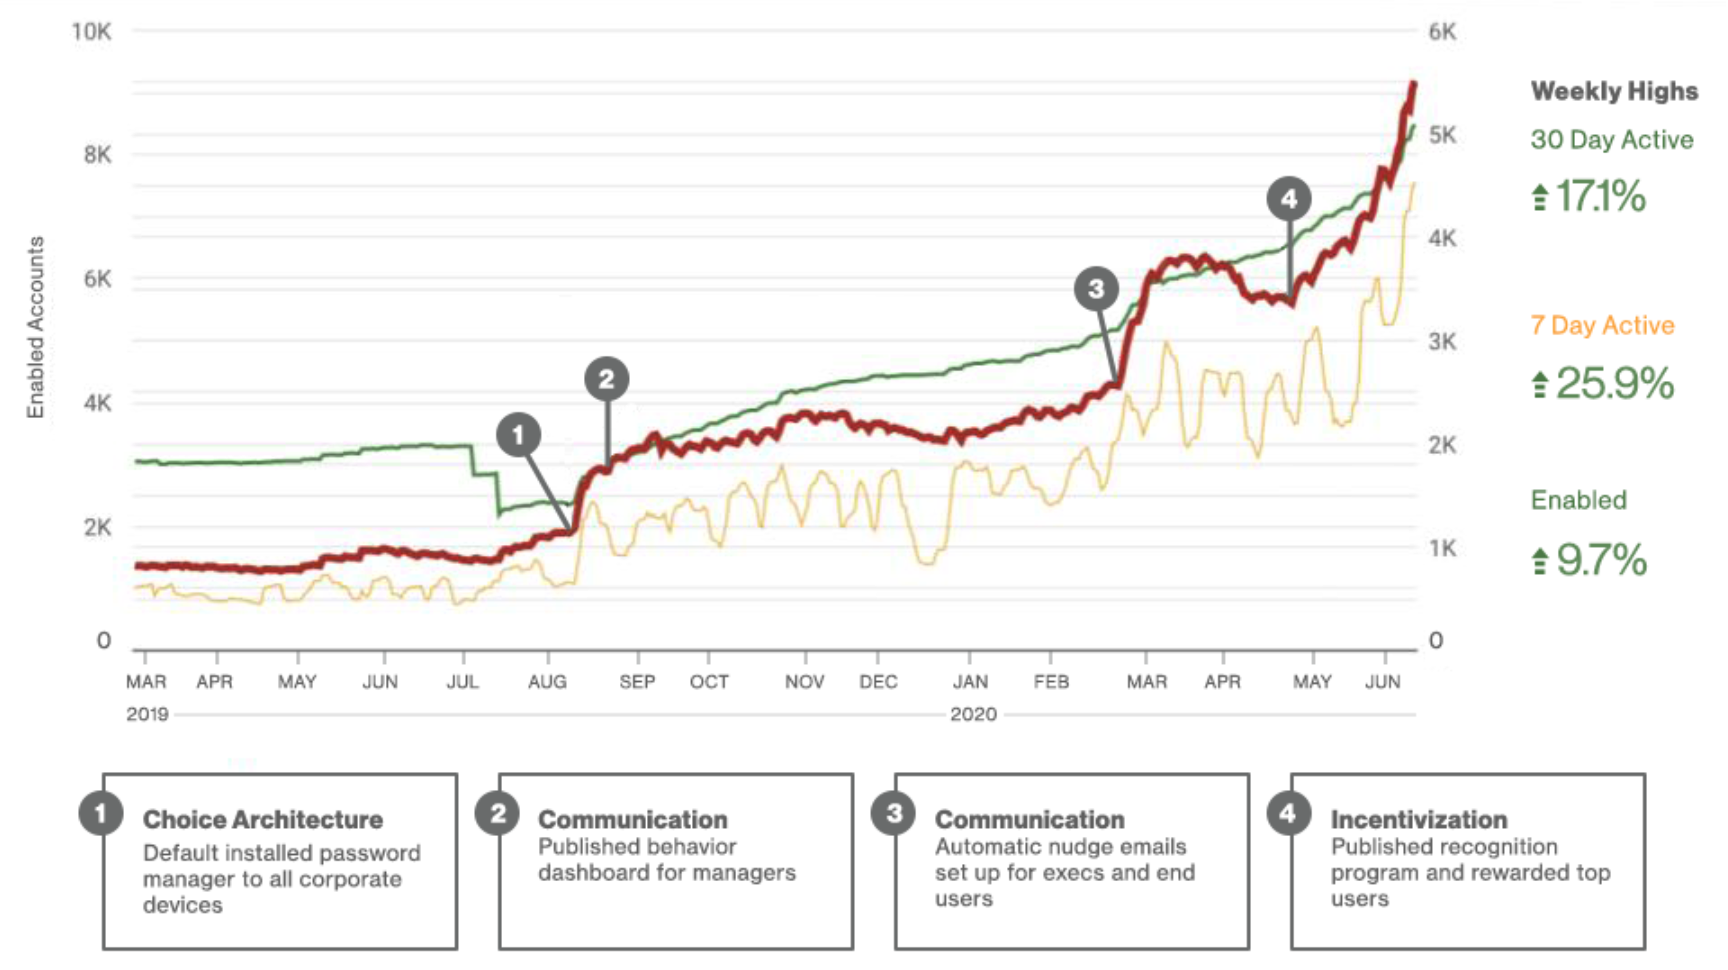

| Description | The Proactive Engagement team enacted a series of experiments to increase password manager adoption, and measured their success. The chart measures the active usage of the company-managed password manager (y-axis) over time (x-axis). The green line represents all enabled password manager users, 30-day active password manager usage is denoted by the red line and 7-day active password manager usage is shown by the yellow line. |
|---|